Machine Learning · Data Analysis
California House Price Prediction
An end-to-end machine learning project exploring California housing data, identifying the factors influencing property values, and comparing regression models to improve prediction accuracy.
Focus
Regression & Predictive Modeling
Tools
Python · Pandas · Scikit-learn
Models
Linear Regression · Random Forest
01 · The Problem
Understanding what drives housing prices.
Housing prices are influenced by several interconnected factors, including income levels, location, population characteristics, and housing attributes.
The goal of this project was to analyze these relationships and develop a regression model capable of predicting median house values from the available housing characteristics.
Objective
Identify the strongest drivers of house prices and build a predictive model that generalizes effectively to unseen data.
02 · The Approach
From raw housing data to predictive modeling.
The project followed an end-to-end machine learning workflow — exploring the dataset, analyzing relationships between variables, training regression models, and evaluating their predictive performance.
01
Data Exploration
Explored 20,640 California housing records and examined the distributions and characteristics of the available features.
02
Relationship Analysis
Analyzed correlations between housing attributes and median house value to identify the strongest predictive relationships.
03
Model Training
Trained Linear Regression as a baseline and Random Forest to capture more complex, non-linear relationships in the data.
04
Model Evaluation
Compared model performance using R² and RMSE to determine which approach produced more accurate predictions.
03 · Model Performance
Random Forest delivered substantially stronger predictions.
The baseline Linear Regression model captured the overall trend in housing prices, but Random Forest modeled the underlying relationships considerably more effectively.
Random Forest achieved a higher R² score while also reducing prediction error, making it the stronger model for this dataset.
0.805
Random Forest R²
Compared with 0.576 for Linear Regression.
0.506
Random Forest RMSE
Reduced from 0.746 with Linear Regression.
20,640
Housing records analyzed
California housing observations used for the analysis.
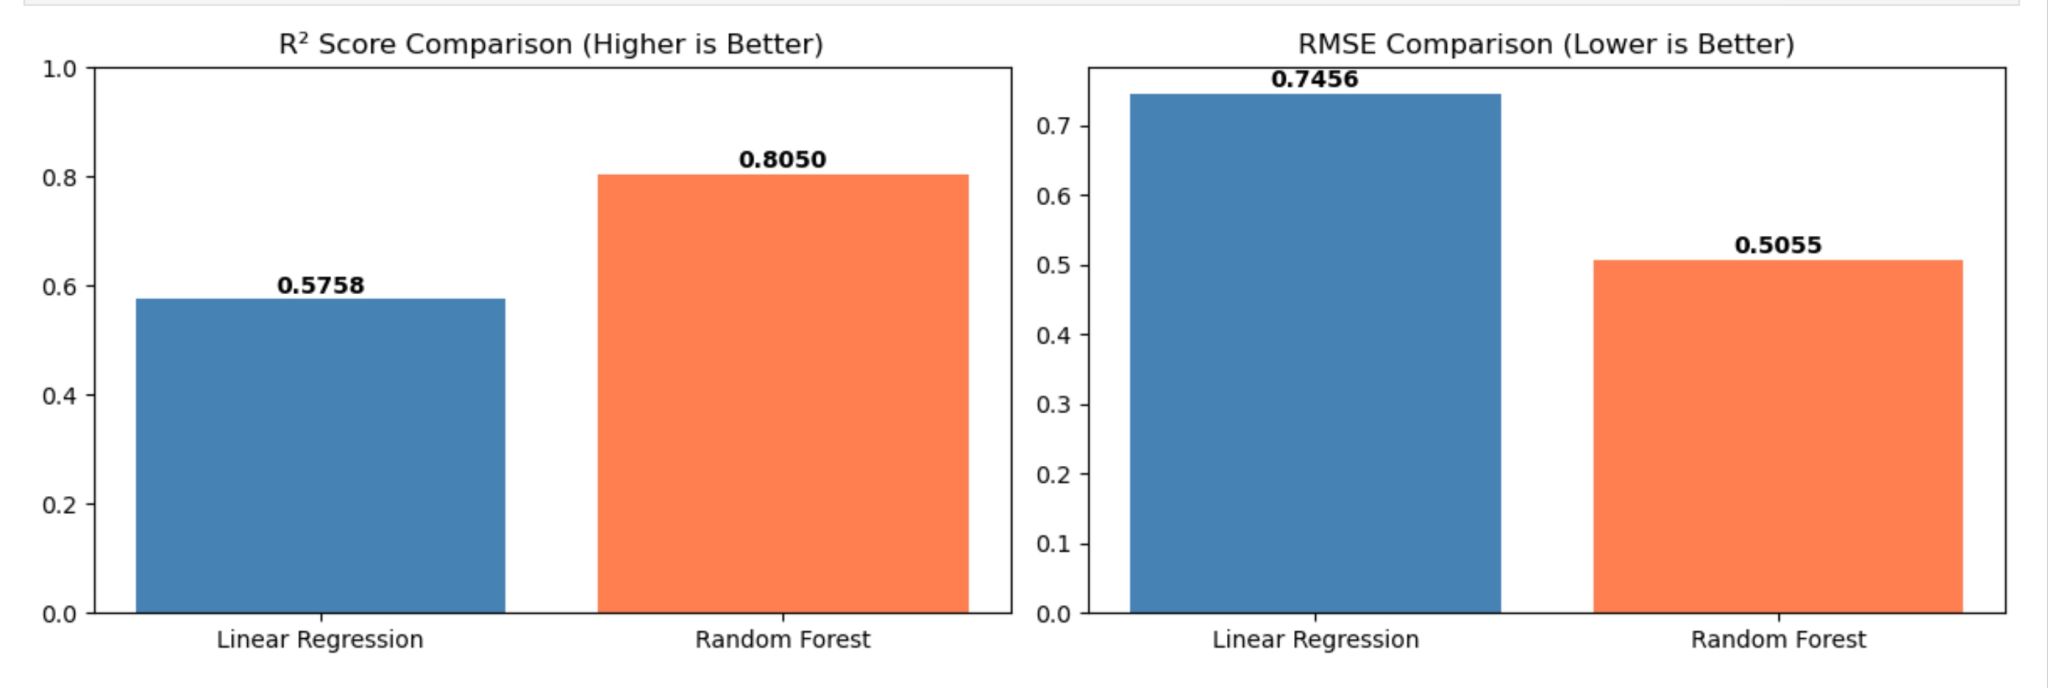
Comparison of Linear Regression and Random Forest using R² and RMSE.
04 · Key Findings
What drives California housing prices?
The analysis showed that housing prices are not influenced equally by every feature. Income and geographic location emerged as the strongest signals in predicting median house values.
01
Median income was the strongest predictor.
Median income accounted for approximately 52% of Random Forest feature importance, making it the most influential variable in the model.
02
Location had substantial predictive value.
Latitude and longitude together contributed approximately 18% of feature importance, highlighting the strong geographic component of California property values.
03
Population had limited influence.
Population contributed less than 3% of feature importance, indicating that it provided relatively little predictive information compared with income and location.
Explore the Project
Want to see the complete analysis and implementation?
Explore the full project repository for the code, data exploration, model development, evaluation, and detailed analysis.